BrainVoyager v23.0
Depth Grids as Flattened Volumes
The previous topic described how grids can be visualized as folded surfaces, as VOIs and as 2D plots. An additional useful representation of depth grids is as "flattened" standard volume representations by stacking 2D grids on top of each other to form standard VMR data sets. This is useful since in this representation the information tangentially across the cortex is represented in "axial" slices while depth information is stored across slices. Most importantly, sampled functional (VMP) data is converted into map data of the same space allowing to insepct, process and visualize the sampled functional depth grid data. Since BrainVoyager 20.2, the conversion of sampled grid data into VMR/VMP data is available in the Visualization tab of the High-Resolution Cortex Grid Sampling dialog (see below).
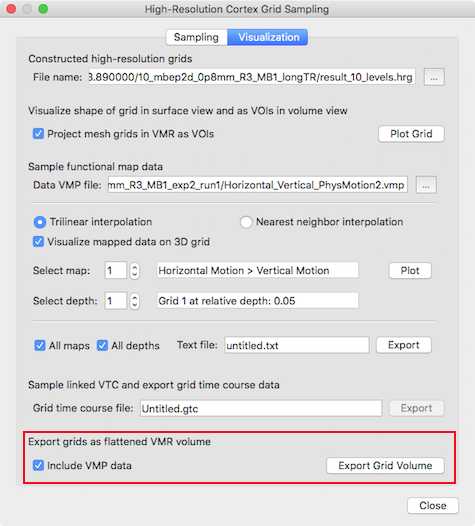
Before creating the volume data, grids need to be created or previously stored grids need to be loaded in the Constructed high-resolution grids field. It is recommended to use grids with about 10 depth levels. Furthermore volume maps should be provided in the Sample functional map data field using the Browse button on the right side of the Data VMP file text field.
The 2D depth grids are converted into VMR data by using the Export Grid Volume button in the Export grids as flattened VMR volume field (see red rectangle in snapshot above). If map data is provided, the Include VMP data option will be turned on automatically; if this option is checked, the provided map data will be sampled on the reconstructed 2D grids and converted into a standard VMP data structure in the same space as the created VMR file. The snapshot below shows the resulting VMR with overlaid functional map data that is presented after clicking the Export Grid Volume data for a example data set.
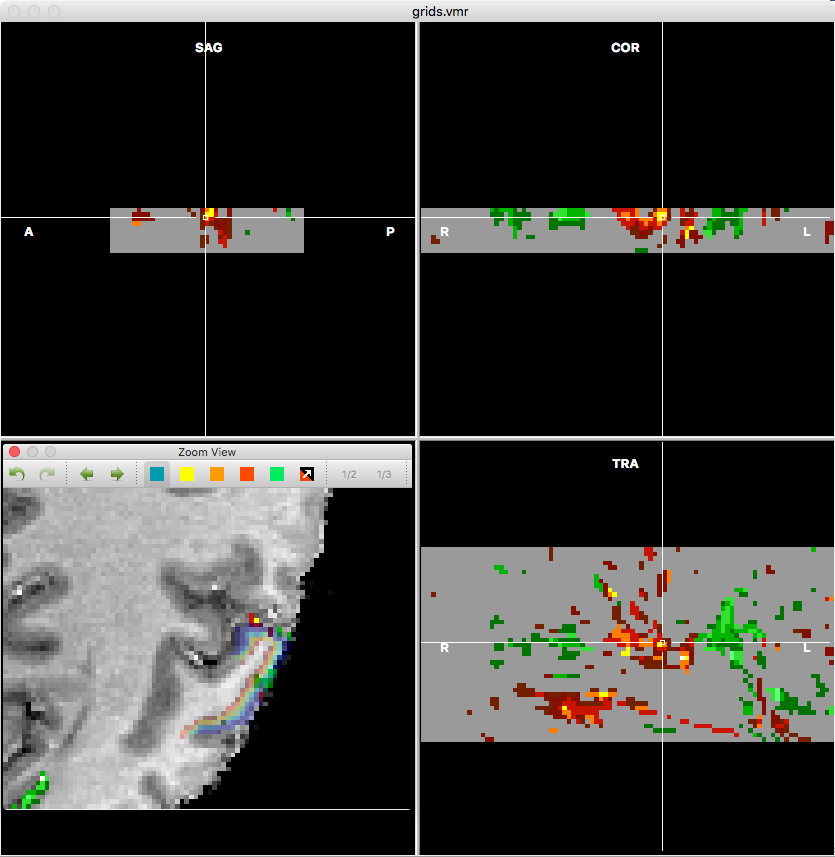
The functional data is sampled in the region shown in the original data in the lower left pane (grids shown as transparent VOIs in rainbow colors). The standard TRA, SAG, COR do not have their usual meaning in this visualization. The TRA view in the lower right pane shows axial slices each showing information in the tangential direction of the cortex at a specific depth level. The SAG and COR views show slices through the cortex revealing how functional (map) data changes from superficial (supragranular) to deep (infragranular) layers. Note that in this visualization superficial layers are shown on top, i.e. going down corresponds to moving towards white matter. In the example data more and higher activity values are observed in the upper layers than in the lower layers, which may be related to the sensitivity of the used EPI sequence for large vessels in the upper layers. Note that the created VMR and VMP files are not saved automatically at present. In order to keep the files for later use, one may want to save the VMR data to disk using the Save As item in the File menu, and the VMP data using the Save As button in the Volume Maps dialog.
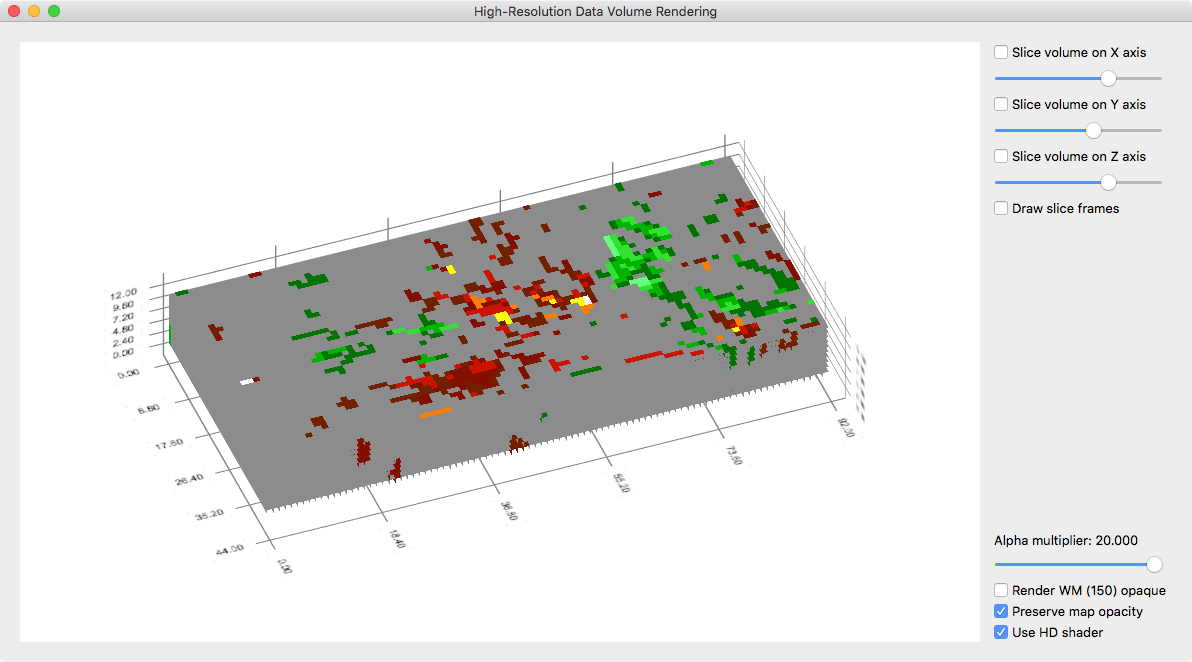
While the data can be inspected with the usual VMR/VMP visualization tools (e.g. navigating the VMR cross and changing map parameters in the Volume Maps dialog), it is useful to visualize it with the high-resolution grid volume rendering tool providing advanced transparent rendering capabilities. The snapshot above shows the volume data of the used example data as it appears in the high-res grid volume renderer. The snapshot below shows the same view but with some transparency of the grey background color. This allows to inspect whether observed functional clusters extent consistently in depth, i.e. to visually inspect a potential columnar functional organization.
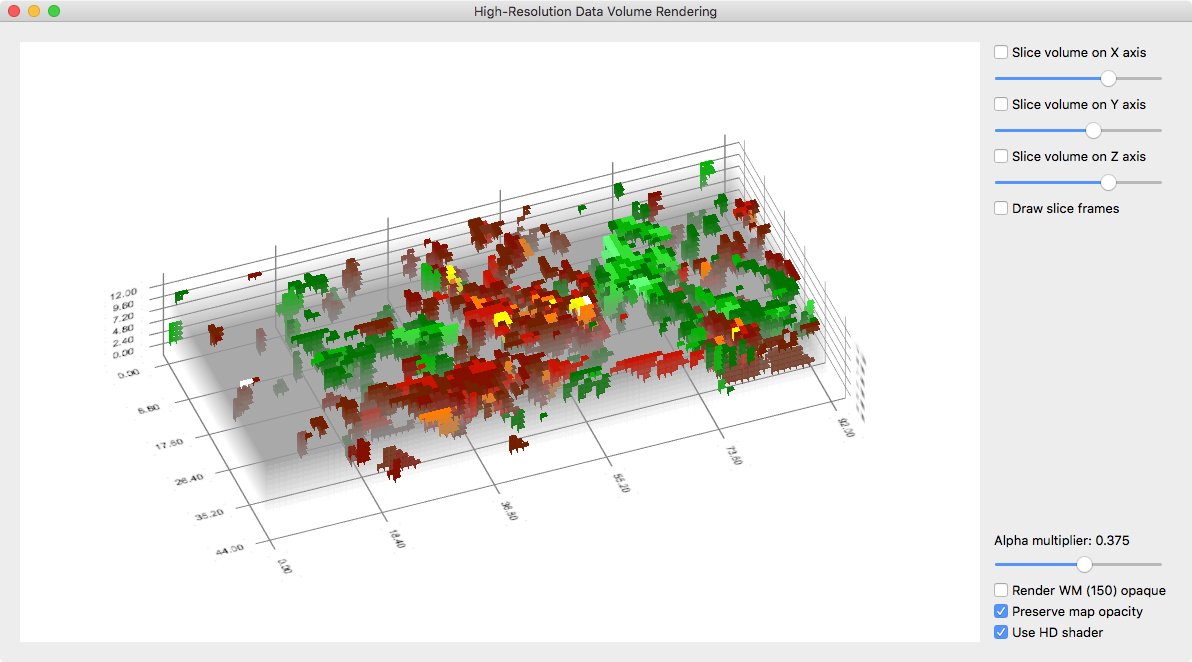
The advanced volume renderer also allows to inspect transparent slices through the data as shown in the snapshot below. To enable slice views, one or more Slice volume on axis selection boxes need to be turned on.
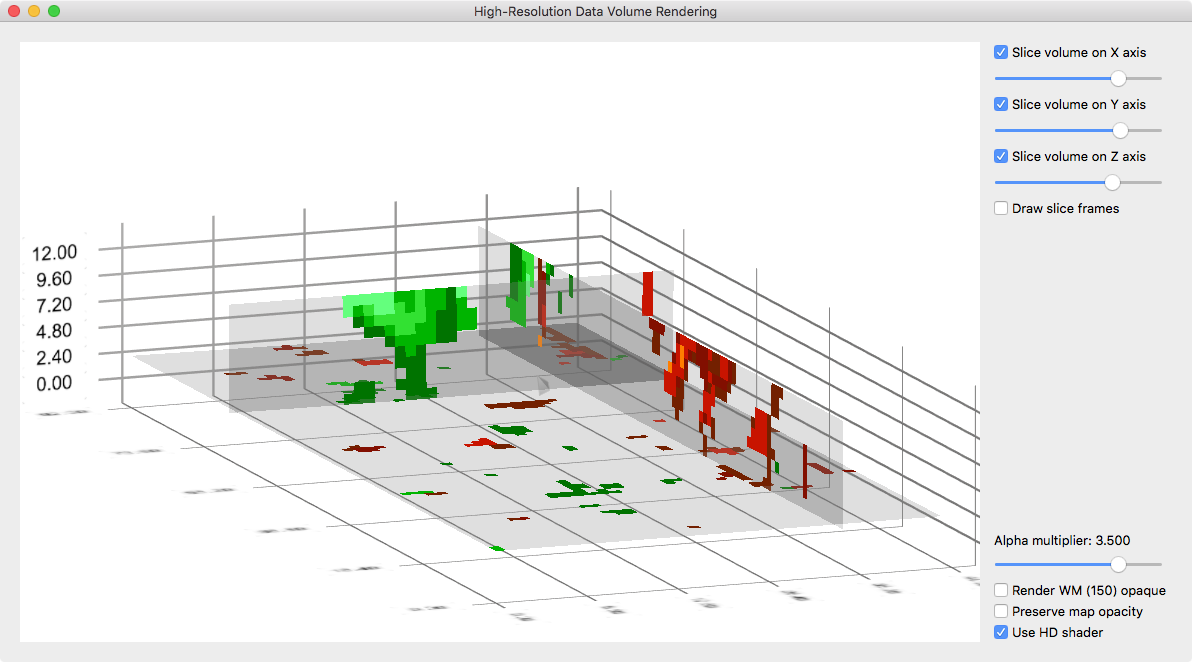
To find good representations, the Alpha multiplier slider can be moved to the left to increase or to the right to dercrease transparency. More details about the grids volume renderer is provided in topic high-resolution grid volume rendering.
Copyright © 2023 Rainer Goebel. All rights reserved.