Turbo-BrainVoyager v3.2
Volume View
In Volume View, recorded slices are stacked on top of each other to form a 1 mm iso-volume. In the snapshot below the individual slices are visible as horizontal stripes, which are due to interleaved slice acquisition. In the example below, the original EPI slices are shown. If T1 or T2 weighted inplanes are recorded prior to the functional runs, it is possible to show a stacked 3D view of these inplanes instead of the EPI slices by clicking on the Overlay On Inplanes item in the View menu. To switch back to the functional slices (first measured volume), click the Overlay On First Func Volume item in the View menu; alternatively, you may use the I key to toggle between the two views. If time is available for performing an extra scan prior to functional runs, it is recommended to record a full 3D anatomical data set instead of an inplane data set. A high-resolution (1 mm iso-voxel) 3D scan can be used for advanced visualizations in the Anatomical Volume View.
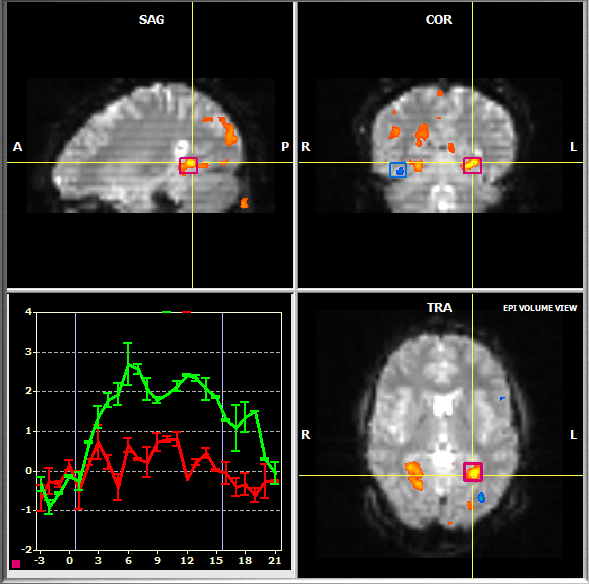
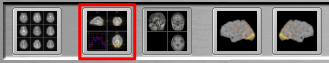
To switch to Volume View, click the Volume View Icon located below the Brain Window (see snapshot above) or press the V button. To navigate in Volume View, click with the left mouse button in one of the three subwindows. The yellow cross highlights the current voxel, which determines the views shown in the respective subwindows. The subwindows display three "cuts" through the data running orthogonally through the current voxel providing a sagittal, coronal and axial view on the brain. Within a subwindow, you may move the mouse while holding the left mouse button down to quickly change the current voxel, which immediately update the slice view in the other two subwindows, respectively.
The selection of ROIs is different in Volume View as compared to Multi-Slice View: To specify a ROI, click with the left mouse button on a voxel within a desired region while holding down the CTRL key. The selected ROI is marked with a rectangle and the averaged time course of all ROI voxels is shown in a corresponding Time Course Window in the same way as described for the Multi-Slice View. You may inspect the selected ROI in other visualizations by clicking on one of the view icons. Since ROI selection is always performed on the raw slice data, the value of the Multi-Slice ROI Selection option determines how many slices will be incorporated for ROI definition.
Event-Related Averaging Plot
The Volume View also shows an Event-Related Averaging Plot in the lower left subwindow. For the current ROI, this plot depicts the average hemodynamic response evoked by a certain stimulus event or condition for the last specified ROI. In order to relate corresponding information with each other, a small rectangle drawn in the same color as the corresponding ROI is shown in the left lower corner of the Event-Related Averaging Plot. The plot shows a curve for each main event/condition of the protocol (the first condition is not shown because it typically defines periods of a baseline condition). The color of each curve matches the color of the one defined for the respective condition in the protocol. If an event or condition occurs the first time, the fMRI signal values are shown as percent signal changes but the standard error bars are set to zero. If the same event or condition occurs subsequently the size of the error bars will be calculated and updated together with the amplitude values.
Copyright © 2014 Rainer Goebel. All rights reserved.