Turbo-BrainVoyager v3.2
Overview
Performing real-time analysis with Turbo-BrainVoyager requires availability of a TBV settings file containing information about the upcoming functional measurement. If a proper TBV settings file is available, real-time analysis can be started by clicking the red Record button. In order to learn how to use Turbo-BrainVoyager, it is recommended to run the provided example data sets.

A TBV settings file can be easily created and modified using the TBV Settings dialog. Once a settings file has been created matching a particular environment (e.g. data format), only small adjustments are typically necessary to create TBV settings files for additional experiments. To select a settings file use the Set New TBV File item in the File menu. When launching Turbo-BrainVoyager the next time, it automatically loads the last used settings file. This allows to inspect and re-analyze the data of the last experiment by clicking the Reload Data button (if the data has not been removed). In case that the next functional run uses the same settings as the previous one, real-time analysis may be simply started by clicking the Record main button. In most cases, however, at least the folder containing the new data and a specific experimental protocol needs to be selected first using the TBV Settings dialog.
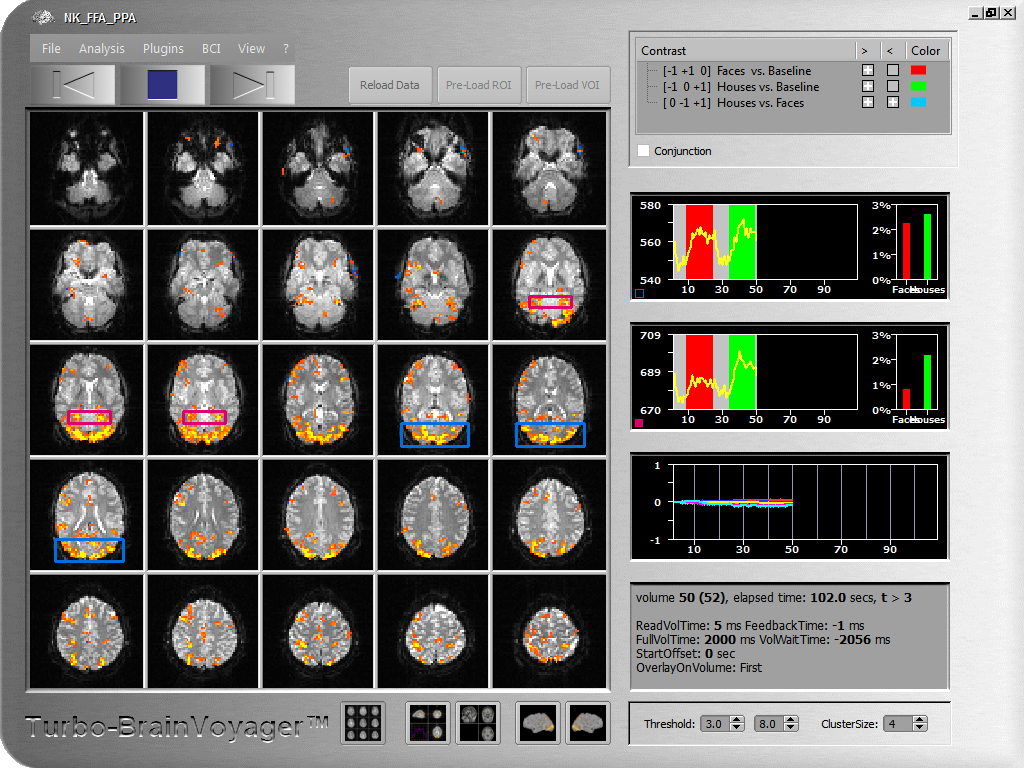
As soon as data becomes available from the scanner, TBV reads it volume-by-volume from a folder, called WatchFolder in the TBV settings file. A few volumes may be discarded according to the NrOfSkippedVolumes entry in the settings file to avoid the T1 saturation effects (high intensity values). If specified, 3D motion correction is performed aligning each (but the first) volume to a reference volume, which is the first volume scanned (and potentially discarded). The detected 6 motion parameters are plotted in a time course window. Each motion corrected volume may be spatially smoothed to increase signal to noise. Incoming volumes (time points) are incrementally statistically analyzed using a General Linear Model (recursive least squares GLM) based on an automatically created design matrix using the provided stimulation protocol. Hypothesis testing is performed using contrasts, which are typically also automatically created. Alternatively, a ContrastFile may be specified in the TBV settings file containing any desired contrast definitions. Available contrasts are shown in the contrast list of the main window and may be turned on and off for display at any time. Up to 4 contrasts may be displayed simultaneously (out of arbitrary many contrasts), each with its own color or with a generic look-up table. Additional confound predictors may be added for removal of linear trends and low-frequency drifts. The incrementally calculated contrast t maps are thresholded with a value specified in the settings file and displayed on the original slices (multi-slice view) as well as more advanced visualizations. The statistical threshold can also be adjusted on the fly during analysis. To suppress isolated voxels, an in-plane cluster-size threshold may be specified.
Various visualizations of the brain are available. The default visualization is a multi-slice view providing a good overview of the updated statistical information on top of the original slices. In single slice view, spatial details and information from individual voxels may be obtained. In a 3D view, the original data may be viewed with 3 orthogonal slice planes. This orthographic 3D view may also show high-resolution anatomical information if available prior to the functional scan. After proper preprocessing, the functional data may run as a movie on high-resolution data in AC-PC or Talairach space as well as on surface visualizations. To inspect the time course of individual voxels or regions-of-interest, various tools are available to easily select interesting ROIs from any of the described visualizations. Selected raw time courses are shown in time course windows together with incrementally updated bar plots showing estimated beta values for main conditions. An event-related averaging plot for the current ROI is visualized in the orthographic 3D view representation.
Copyright © 2014 Rainer Goebel. All rights reserved.