Turbo-BrainVoyager v3.2
The Graphical User Interface
The following figure shows the main parts of the graphical user interface (GUI) of Turbo-BrainVoyager's main window. Click on a region in the figure to obtain further information.
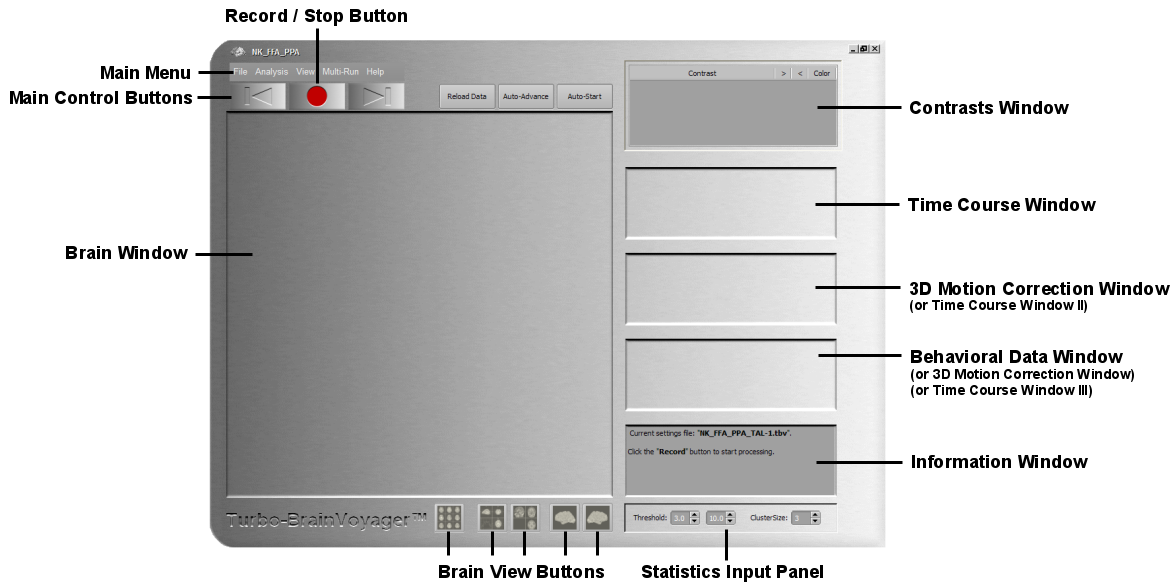
To start real-time data analysis, simply click the Record/Stop button. Note, however, that several settings have to be specified before the analysis can be performed.