Besides presenting generated document files in the Data tab, workflows also generate reports containing documentation about the executed workflow(s) and the created documents. The goal of the provided information is to present a summary of the steps of the processesing pipeline executed by a workflow, including chosen parameter settings. Furthermore, workflow reports contain images of obtained results for many processing steps serving as a quality assurance tool, i.e. the documented image data and text descriptions allow checking whether executed routines have operated as expected.
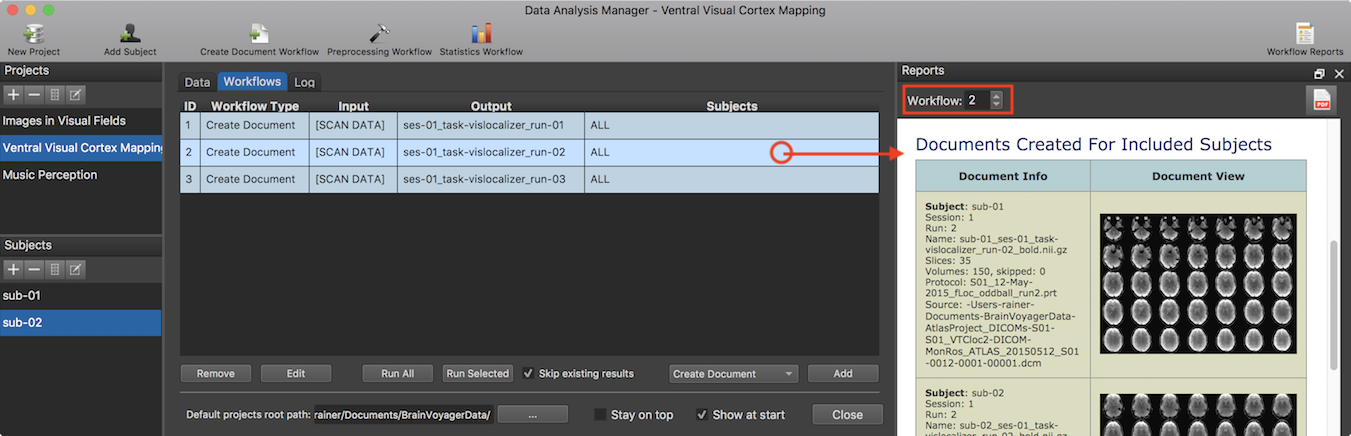
The screenshot above shows, for example, a part of the report generated for the second workflow of the three executed Create Document workflows described in the previous topic. Besides clicking a workflow in the Workflows table, one can also switch to a specific workflow by using the Workflow number spin box at the top of the Reports pane (see red rectangle in screenshot above). The Reports pane can be docked on the right side of the Data Analysis Manager window as shown above, but it can also be detached by clicking the Undock icon on the right upper side of the title bar of the Reports pane, or by grabbing its title bar and simply dragging it out. It can also be moved back and docked in the Data Analysis Manager window dropping it on the right side when the docking area appears; alternatively one can simply clidk the title bar of the undocked Reports pane and it will jump back in its dock area. The screenshot below shows the Reports pane after undocking it from the manager window allowing to resize it to cover more screen space.
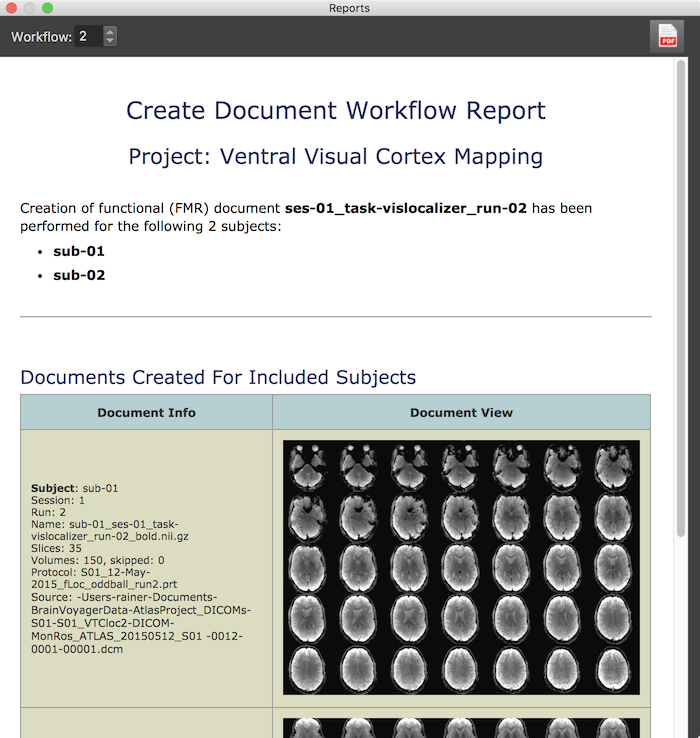
If not needed, the Reports pane can be closed by ckicking the Close icon on the left (or right) side of its title bar. To display it again, the Workflow Reports icon on the right side of the main toolbar of the Data Analysis Manager window can be used. This icon operates as a toggle, i.e. it will show/hide the Reports pane when clicked repeatedly. As can be seen in the screenshot above, a report describes the type of the executed workflow (here "Create Document"), the project it is applied to (here "Ventral Visual Cortex Mapping"), the generic name of the created doucment(s) (here "ses-01_task-vislocalizer_run-02") and the number and code names of the subjects that were included when processing the data (here "sub-01" and "sub-02"). While this overview information is similar for each workflow type, the subsequent image and text documentation is specific for the type of workflow. The screenshot above shows specific information when running the Create Document workflow for the available data of the project. For each subject, descriptive information is sown on the left side (including session and run information, which protocol has been linked to the created FMR document, the number of slices and volumes and so on) and on the right side an image shows how the created document looks like, which is helpful as a quality assurance test.
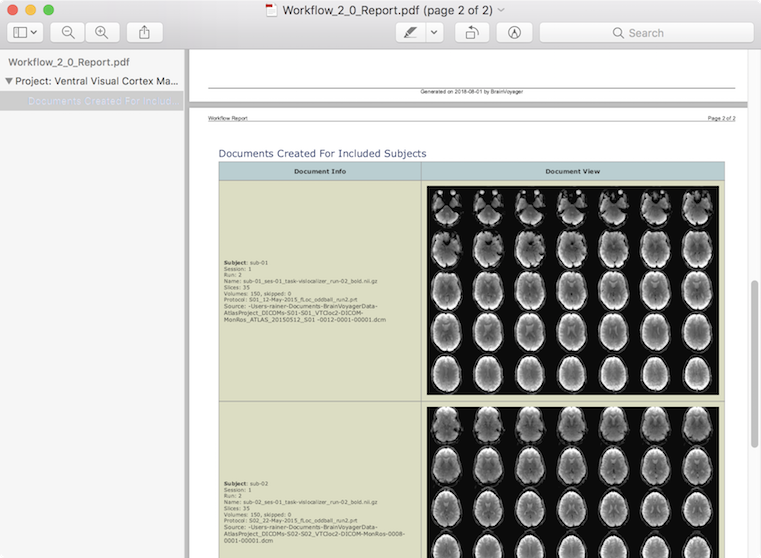
Reports are generated and displayed as HTML documents. These are however also converted in paginated PDF documents that are shown in the BrainVoyager PDF Viewer or in the default PDF viewer of the used operating system (e.g. "Preview" on macOS) when clicking the PDF icon in the right upper section of the Reports pane. The generated PDF files contain a table of contents that can be used to quickly go to relevant pages in case of long reports. Note that generated HTML and PDF documents can also be opened directly from the "_Workflows_" folder that is stored under the "derivatives" folder within the project data folder as described earlier.