Turbo-BrainVoyager v3.2
Multi-Slice View
In Multi-Slice View, recorded slices are shown in a matrix arrangement allowing to inspect computed statistical results in the whole brain at once. The values of the NrOfRows and NrOfColumns in the Data Format tab of the TBV Settings dialog determine how the data is arranged in Multi-Slice View. In order to show all slices (recommended), the product of number of rows and number of columns should be equalto (or greater than) the number of recorded slices specified in the NrOfSlices parameter. Since the Brain Window is square in the Windows version of TBV, pixels in slices may not be square in case that the number of rows and columns are not the same. To switch to Multi-Slice View, click the Multi-Slice View Icon located below the Brain Window (see snapshot below) or press the F key.
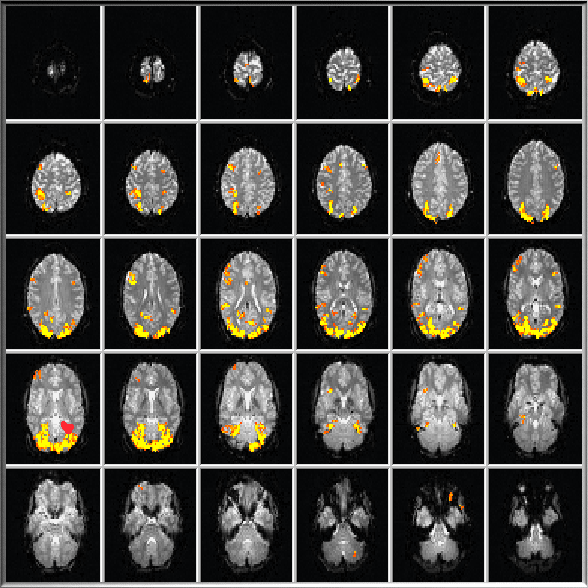
The snapshot above shows the Brain Window with an example of a Multi-Slice View with a 5 rows x 6 columns arrangement displaying all 30 slices recorded in this particular example. During or after real-time processing, you can select regions-of-interest by dragging a rectangle around "significant" pixels. The averaged time course of the significant voxels within the specified ROI is immediately shown in one of the Time Course Windows. If you specify a ROI which does not contain any significant voxels, the Time Course Window shows the average of all voxels within the rectangle. Time Course Windows are continously updated for the selected ROI until a new ROI replaces its content. Note that additional slices above and below the current slice may be used to define ROIs by dragging if the value of Multi-Slice ROI Selection is larger than "1". This parameter can be set in the TBV Settings dialog prior to a functional run or directly modified using the MultiSliceROIs spin box within the input panel at the bottom of the program window.
To visualize several ROIs simultaneously, hold down the ALT key while dragging a rectangle with the left mouse. If multiple ROIs are selected, you can make one of them the current one by clicking in the respective Time Course Window. Specified ROIs can be identified because they are drawn in color. In order to relate corresponding information with each other, a small rectangle in the same color as the ROI is also drawn in the left lower part of a Time Course Window.
Note on multiple ROI selection: Since the ALT key triggers on some Linux systems a movement operation of the underlying Window, ROI selection should be performed on these systems in the following order: first start the dragging by clicking with the left mouse, then drag the rectangle around the region-of-interest and at any time before releasing the mouse key, press and hold the ALT key.
Visualizing on EPI Images or High-Resolution Inplane Images
As default, statistical contrast maps are always visualized on the first recorded set of functional (EPI) slices (see snapshot above for en example). The first EPI volume is used for display since the first scan of each slice is T1-saturated and, thus, shows structural details not visible in later measurements (if short TR's are used). For quality checks it may be useful to show the current set of functional slices instead of the first volume. This can be achieved using the C key that toggles between showing the first or current volume. One can also use the Overlay on First Func Volume option or Overlay on Current Func Volume option in the View menu. In case that the current functional volume is shown, the B key can be used to toggle between display of the current volume before or after spatial preprocessing that usually includes motion correction and eventually spatial smoothing. The currently chosen selection is displayed in the Log pane during real-time processing.
For better visualization of anatomical details, coplanar (T1 or T2 weighted) inplane images may be recorded prior to functional runs. Coplanar images are scans with the same slice positions as used for the subsequent functional recordings but have a higher inplane resolution. If coplanar images are available, you may toggle between EPI and coplanar images using the Overlay On First Func Volume and Overlay On Inplanes items in the View menu or press the I (for "inplane") button.
NOTE: If time is available, it is advisable to scan high-resolution (1 mm iso-voxel) T1-weighted 3D images instead of coplanar images before functional scanning since these anatomical scans provide more details in all dimensions and allow visualizing the data in AC-PC or Talairach space.
Copyright © 2014 Rainer Goebel. All rights reserved.