Turbo-BrainVoyager v3.2
Preparing Advanced Visualizations
TBV allows to visualize statistical maps on various brain views. The Single Slice View and Volume View (stacked slices) are always available when analyzing data. The Anatomical Volume View and Surface View, however, require additional preparatory steps, which are described below in the context of typical scenarios. These options not only provide the possibility of advanced 3D visualizations but also allow to use volumes-of-interest (VOIs) across scanning sessions.
Note: The advanced visualization options are only available if appropriate slice positioning information is available for both the intra-session functional and 3D anatomical data sets. Furthermore, most scenarios currently require the use of BrainVoyager QX.
Scenario 1 - Visualizing on Intra-Session 3D Anatomical Data Set
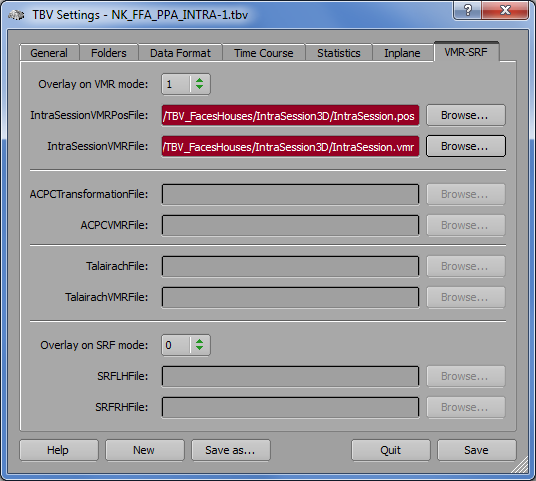
Visualizing statistical maps on a high-resolution 3D data set allows to localize active clusters more accurately. This scenario requires that an anatomical scan is performed in the same scanning session prior to subsequent functional runs of the subject. At present, you must create a VMR file from the raw data using BrainVoyager QX. The 3D anatomical scan must have a resolution of 1 mm in all dimensions. If this is not the case, use BrainVoyager QX to "iso-voxel" the 3D data to 1mm voxels first. TBV will coregister the functional data to the 3D anatomical scan at the beginning of a real-time run. This requires proper slice positioning information for both the functional data and the 3D anatomical data set. For the 3D data set a ".POS" file specifying the slice position of the anatomical data set is automatically created when creating the VMR file in BrainVoyager QX. For further information, sent an email to goebel@brainvoyager.com. When subsequently getting information about the slice positions of the functional run(s), TBV is automatically coregistering the functional and anatomical data set. To enable the intra-session scenario for same-session functional analyses, select entry "1" in the Overlay on VMR mode combo box of the VMR-SRF tab in the TBV Settings dialog (see snapshots below). This will enable two (or three) fields for specifying the necessary files for intra-session visualization. To select the slice position (.POS) file of the anatomical 3D data set, click the Browse button on the right side of the IntraSessionVMRPosFile text box (see snapshots below). To specify the anatomical file itself, use the Browse button on the right side of the IntraSessionVMRFile text box. The anatomical 3D data set must be in BrainVoyager's native VMR format (or in Analyze format for the ANALYZE_NW data format). To update the TBV Settings file with the new settings, click the Save button in the lower right corner.
Scanner Data Format Specific Instructions
SIEMENS_DICOM_MOSAIC and GE_HDXT_DICOM. Formats based on DICOM files contain all necessary positioning information. When creating a VMR file both required input files are generated, a VMR data file and a slice position POS file. At present, the creation of these files requires BrainVoyager QX. Use the Browse button on the right side of the IntraSessionVMRPosFile text field and the IntraSessionVMRFile text field to select the created POS and VMR files, respectively (see snapshot below).
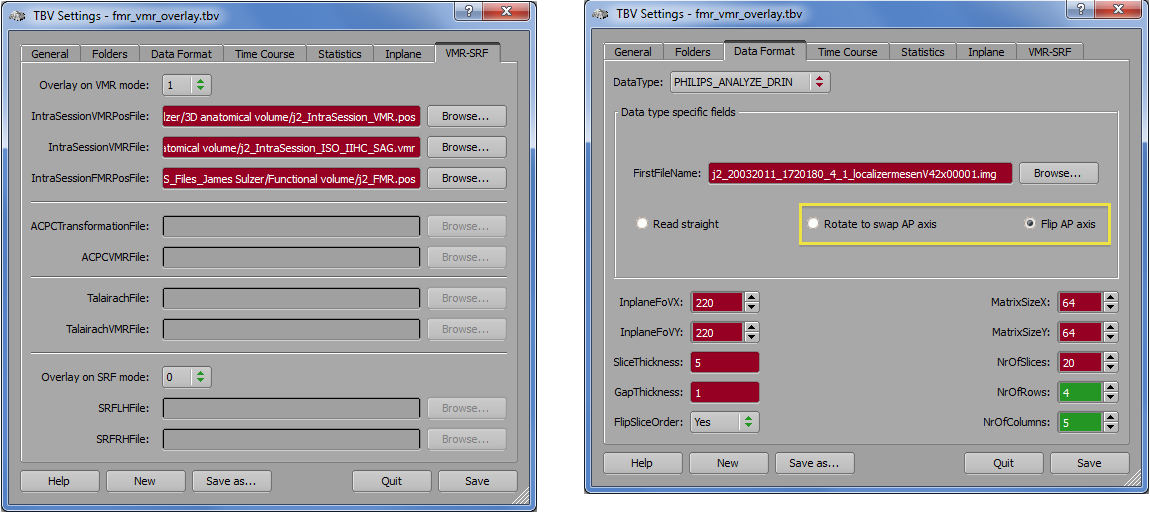
PHILIPS_ANALYZE_DRIN. The Philips real-time export generates a series of Analyze volume files that do not contain slice positioning information for the functional data. In order to nonetheless obtain slice positioning information, one needs to run a short scan of a few seconds (one functional volume is sufficient) to generate a standard .REC/.PAR functional data set. Note that this scan must use exactly the same slice positioning parameters as used for the subsequent real-time runs producing Analyze files. Using BrainVoyager QX, a functional (FMR) project needs to be created from the functional .REC/.PAR data that produces (next to other files) a proper slice positioning POS file for the functional data. Use the Browse button on the right side of the IntraSessionFMRPosFile text field and select the generated POS file for the functional data (see snapshot below).
Processing of the intra-session 3D anatomical data proceeds similar as for other data formats. A performed intra-session anatomical scan will produce a standard .REC/.PAR data set. Use BrainVoyager QX to generate a VMR project from this data resulting in a VMR as well as a POS file. If BrainVoyager QX detects that the anatomical data does not contain 1 mm cubic voxels, it will suggest to "iso-voxel" the data. You need to accept this suggestion, otherwise TBV will not visualize the data correctly. The correct VMR file will be identifiable by a "_ISO" label in the file name. BrainVoyager will also suggest to transform the 3D data into standard neurological format by suggesting a "To SAG" transformation step. Even if your data is recorded as sagittal slices, you should accept this suggestion since TBV assumes that functional and anatomical data is stored in radiological convention (left-is-right) and not in neurological convention (left-is-left) and the generated .POS file also follows this assumption. The resulting VMR file will be identifiable by a "_SAG" label in the resulting file name. In order to match the left-right convention of the functional data to the anatomical data, you also need to keep the default setting Flip AP axis when selecting the real-time functional data in the Data type specific fields of the Data Format tab (see snapshot below, right side). Note also that Turbo-BrainVoyager does not guarantee knowledge about the left/right convention. If you want to be sure about this use additional measures (such as placing vitamin capsules that are visible in MR images on one side of the head). When the POS and VMR files for the intra-session anatomical data are available select them using the Browse button on the right side of the IntraSessionVMRPosFile text field and the IntraSessionVMRFile text field, respectively (see snapshot below, left side).
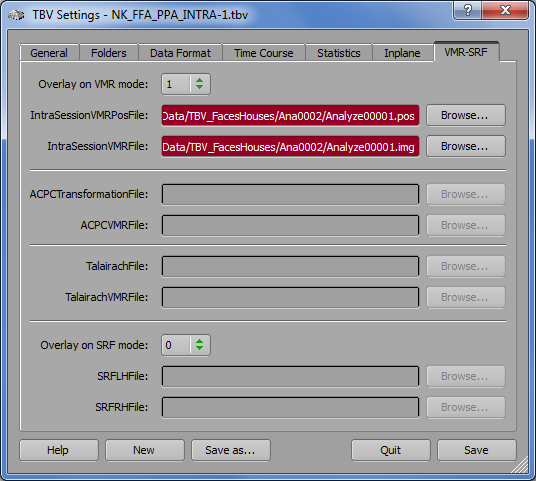
SIEMENS_NW. In the context of this format that is used on older Siemens scanners, the 3D data set is stored as an Analzye (.img) file together with an automatically generated proper .POS file based on an export program developed by Nikolaus Weiskopf. For this format, the use of BrainVoyager QX is not required. Use the Browse button on the right side of the IntraSessionVMRPosFile text field and the IntraSessionVMRFile text field to select the automatically created POS and IMG (Analyze) file, respectively (see snapshot below).
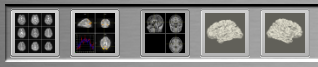
When subsequently running functional real-time analyses, the Anatomical Volume View icon will be enabled (third icon from the left side in the snapshot below). Click the icon to switch to the Anatomical Volume View visualization in intra-session 3D space.
Scenario 2 - Visualizing on AC-PC Space 3D Anatomical Data Set
Visualizing statistical maps on a AC-PC transformed high-resolution anatomical data set allows to view activation patterns in a common "near-Talairach" space while keeping the geometry of the subject's brain intact. As in the intra-session scenario, this visualization option requires scanning a 1 mm 3D data set prior to the functional runs. The 3D data set is necessary for computing a AC-PC spatial transformation (.TRF) file. The AC-PC transformation file can be either produced from the 3D data set itself (scenario 2a) or by automatically aligning it with another AC-PC data set (scenario 2b) of the same subject obtained in an earlier session. The AC-PC transformation in scenario 2a has to be done in BrainVoyager after the anatomical data set has been performed and before the functional runs are started. In scenario 2b the transformation file can be calculated directly within TBV since a different AC-PC transformed data set is already available from a previous session. The creation of the AC-PC transformation file for scenario 2b can be performed in TBV with the aid of the VMR-VMR Coregistration dialog, which can be invoked by clicking the VMR-VMR Coregistration item in the File menu.
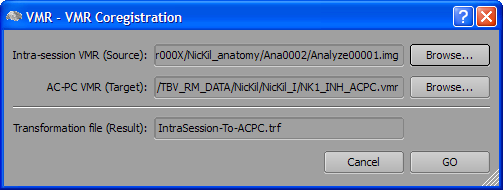
Use the Browse button on the right side of the Intra-session VMR (Source) text field to select the 3D data set measured in the current session. Use the Browse button on the right side of the AC-PC VMR (Target) text field to select the AC-PC transformed data set from a previous session. The name of the resulting transformation (.TRF) file can be edited in the Transformation file (Result) text field. To start the alignment, click the GO button. When the alignment procedure returns, the main window will show the transformed intra-session 3D data set, which now should fit the extra-session AC-PC data set. To check whether the alignment was successful, you can repeatedly press the F8 key to toggle between the two data sets.
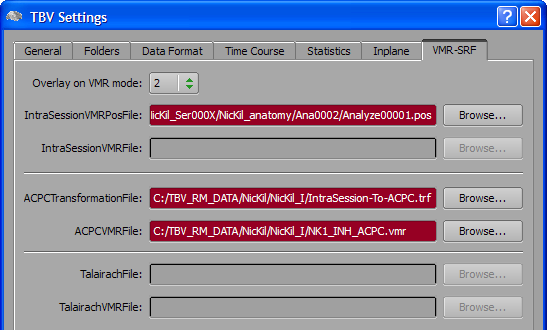
To enable visualizing statistical maps on a AC-PC data set, select entry "2" in the Overlay on VMR mode combo box of the VMR-SRF tab in the TBV Settings dialog (see snapshot below). This will disable the IntraSessionVMRFile entry but enables the ACPCTransformationFile and ACPCVMRFile entries. Use the respective Browse buttons to select the AC-PC transformation (.TRF) file and the AC-PC anatomical 3D (.VMR) file, respectively.
When subsequently running functional real-time analyses, the Anatomical Volume View icon will be enabled as in scenario 1. When the icon is clicked, the Anatomical Volume View will show now the specified AC-PC data set instead of the intra-session 3D data set.
Scenario 3 - Visualizing on Talairach Space 3D Anatomical Data Set
Visualizing statistical maps in Talairach space allows to view activation patterns in a common space. It also allows to import or export volumes-of-interest (VOIs) in Talairach space, which is, for example, important for neurofeedback applications since identified regions can be used in later real-time sessions by reloading VOIs. As in the previously described scenarios, this visualization option requires scanning a 1 mm 3D data set prior to the functional runs. The intra-session 3D data set is also here necessary for computing a AC-PC spatial transformation (.TRF) file, which is used as the first step of Talairach transformation. As described above, the AC-PC transformation file can be either produced from the 3D data set itself (scenario 3a) or by automatically aligning it with another AC-PC data set (scenario 3b) of the same subject obtained in an earlier session. In addition to the AC-PC file, a Talairach landmark (.TAL) file is finally needed, which must be created at present with BrainVoyager QX. If Talairach normalization data is available from a previous session - AC-PC 3D file, Talairach normalized 3D file, Talairach landmark file - the only necessary step to be performed is the automatic creation of the AC-PC transformation file, which can be performed in TBV as described above.
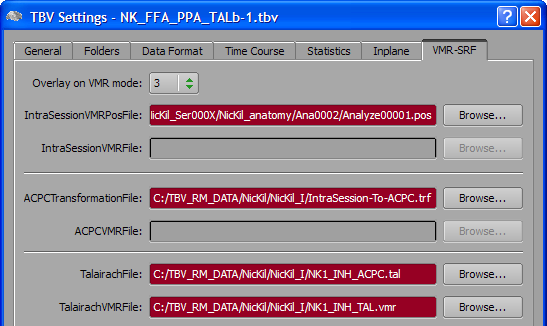
To enable visualizing statistical maps on the Talairach space 3D data set, select entry "3" in the Overlay on VMR mode combo box of the VMR-SRF tab in the TBV Settings dialog (see snapshot above). This will disable the IntraSessionVMRFile and ACPCVMRFile entries but enables the ACPCTransformationFile, TalairachFile and TalairachVMRFile entries. Use the respective Browse buttons to select the AC-PC transformation (.TRF) file, the Talairach landmark (.TAL) file and the Talairach space anatomical 3D (.VMR) file, respectively.
When subsequently running functional real-time analyses, the Anatomical Volume View icon will be enabled as in scenario 1. When the icon is clicked, the Anatomical Volume View will show now the specified Talairach VMR data set. To visualize statistical maps in Talairach (or AC-PC space), a combined transformation data structure is kept in memory,which allows to determine corresponding voxels in raw data space for each voxel in AC-PC or Talairach space. Note that statistical analysis (e.g. calculation of dynamic contrast maps) is always performed in raw data space.
Visualizing on reconstructed cortex meshes
Visualizing dynamic statistical maps on cortex meshes is very attractive because it provides an easy understandable 3D view of the brain. Surface meshes may be rotated and zoomed allowing to inspect any desired region during real-time analysis. Cortex meshes must be created in BrainVoyager QX prior to subsequent real-time analysis sessions with the same subject. Cortex visualizations require one of the three scenarios described above, preferably scenario 2 (AC-PC space) or 3 (Talairach space). To use surface representations, one or two meshes may be specified, typically one mesh for the left and one mesh for the right hemisphere. Note that the meshes must be in the same space as is used in the Anatomical Volume View, i.e. the space of the surfaces must match the space of the respective scenario.
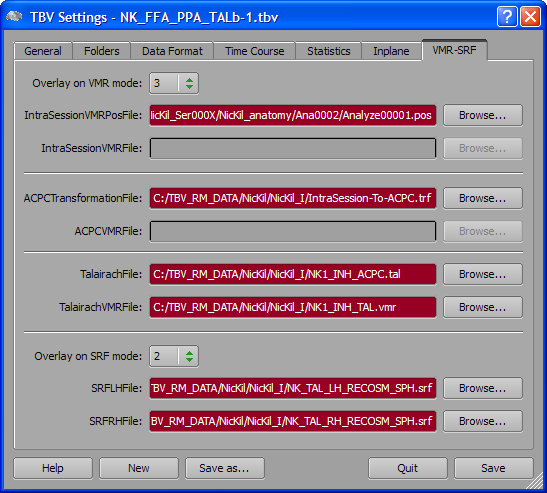
In order to allow fast rotation and zooming operations, it is recommended to use downsampled versions of the respective meshes, e.g. meshes produces in the initial step of cortex-based alignment. This has been done in the example shown above as indicated by the "_SPH" part in the mesh names.
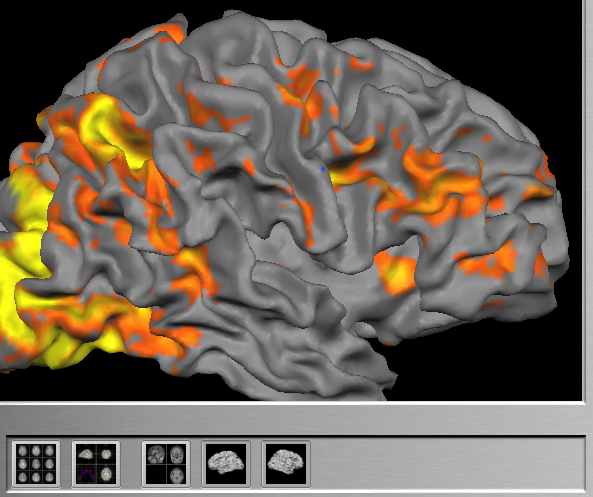
When subsequently running real-time analyses, the Surface View icons will be enabled (see snapshot above); if value "1" has been selected in the Overlay on SRF mode combo box of the TBV Settings dialog, only the left surface icon will be enabled since only one mesh has been specified. Click one of the Surface View icons to switch to the Surface View visualization. If both icons are enabled, you may turn on/off display of one of the two meshes by clicking the respective icon, but it is not possible to turn off both meshes at the same time.
Copyright © 2014 Rainer Goebel. All rights reserved.