Turbo-BrainVoyager v3.2
Time Course Windows
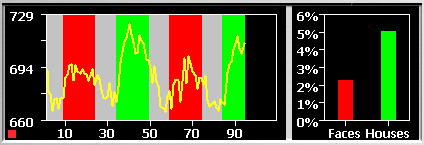
Time Course Windows show the time course of regions-of-interest (ROIs) selected in one of the brain visualizations in the Brain Window. Time courses are usually shown in respective slots in the main window but can also be shown within the Time Courses Container. The x-axis of a Time Course Window displays time while the y-axis displays the fMRI signal strength (raw values). A Time Course Window is filled from left to right with incoming data, i.e. it is updated as soon as a new data point is available. The time course shown represents the average time course from all voxels in the corresponding ROI. Each window corresponds to exactly one ROI. The color of the little square in the left lower corner of the window indicates the ROI from which the time course has been drawn. The matching ROI is demarcated in the Brain Window with the same color. If the square is filled, the respective Time Course Window and its associated ROI is made the current one. The current window has a special status. If a new ROI is selected in one of the brain views without holding down the SHIFT key, the current ROI is replaced by the newly selected ROI and its time course is shown in the current Time Course Window. Furthermore, the time course of the current ROI is used to calculate event-related averaging data, which is displayed in the lower left sub-window of the (Anatomical) Volume View. Any of the available Time Course Windows can be made current by clicking into the respective window. This will fill the small square while the rectangles in all other windows are shown unfilled.
If enabled (default), a Time Course Window also shows estimated beta values for main conditions of the protocol as a bar graph on the right side. These beta values are estimated by a incremental General Linear Model using the time course data plotted on the left side. The beta bar plots are updated on the fly, i.e. the beta values are re-calculated as soon as new data becomes available. The bars reflect mean per cent signal change with respect to the baseline signal level (modeled by a constant term predictor). The colors of the bars reflect the colors of the respective conditions defined in the protocol. The names of the conditions are also shown below each bar. The beta bar plot can be turned on/off by pressing the CTRL-B key combination. The horizontal space reserved for the bar plot can be adjusted by pressing CTRL-N (enlarge space) and CTRL-M (shrink space).
After real-time analysis has been completed, a context menu can be invoked by right-clicking within a Time Course Window. From the context menu, a ROI GLM analysis can be launched providing text information (tables) and graphical output about estimated GLM parameters.
Note that there are maximally three window slots available to show ROI time courses embedded in the main program window. If enabled, the plots of motion correction parameters will use one of the time course window slots in the main window. Eventually another window will be used to show behavioral data (recorded button presses, not used at present). If more ROI time courses are requested by SHIFT-selection in the Brain Window, the Time Courses Container will appear to display the respective time course data.
Copyright © 2014 Rainer Goebel. All rights reserved.