Turbo-BrainVoyager v4.4
Anatomical Volume View
This view allows to visualize contrast maps on high-resolution 3D data sets, which must be recorded prior to the functional runs. There are several scenarios possible for using the Anatomical Volume View including visualization on the intra-session 3D data, visualization on a intra- or extra-session AC-PC, MNI or Talairach transformed datasets. For details how to prepare these scenarios, see section Preparing Advanced Spaces. To switch to this view, click the Anatomical Volume View Icon located below the Brain Window (see screenshot below) or press the A key.
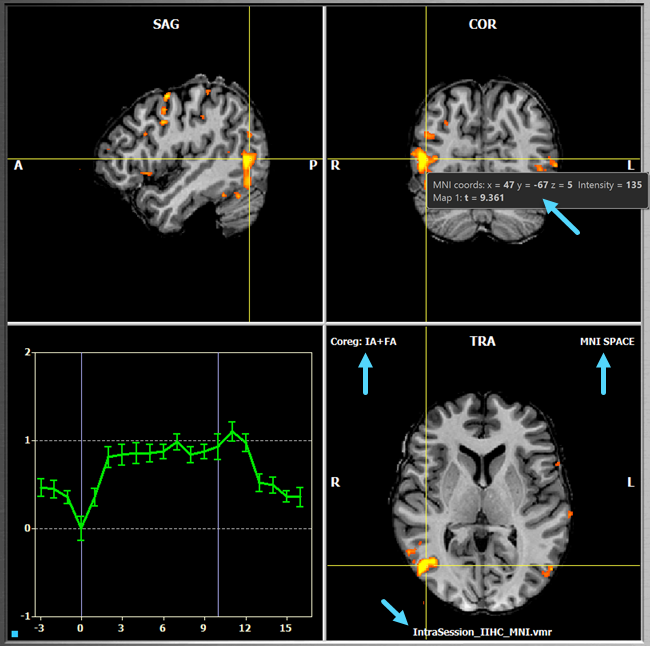
Navigation in Anatomical Volume View operates in the same way as in (stacked EPI slices) Volume View by moving the mouse in one of the three sub-windows while holding down the (left) mouse button. The yellow cross highlights the current voxel, which determines the slices shown in the sagittal, coronal and axial (transversal) orthographic sub-views. In the screenshot above, the blue arrows indicate provided information about the data and the current voxel. When moving the mouse without pressing a button (i.e. hovering), information about the voxel under the mouse presented is presented in a small window containing voxel cooredinates and statistical (t value) information for each overlaid contrast map. Since the VMR data displayed in the screenshot above has been normalized to MNI space, the voxel coordinates are provided as MNI coordinates. The arrows in the "TRA" sub-view indicate information about the reference space of the data ("MNI SPACE" in the example above), the performed FMR-VMR coregistration (both initial header-based "IA" alignment and fine-tuning iterative adjustment "FA" alginment in the example above) and the name of the displayed data set (here: "IntraSession_IIHC_MNI.vmr").
The selection of ROIs also works similar as in Volume View: To specify a ROI, called Volume-Of-Interest or VOI in this view, click with the left mouse button on a voxel within a desired (active) region while holding down the CTRL key. Unlike as in Volume View, the VOI is defined as a spherical region around the clicked voxel limited to the extent of the active region below the mouse pointer. The defined VOI is visualized by showing all involved voxels in the same color as the respective ROI in original function space. The ROI is actually produced by mapping the voxels of the spherical VOI into original functional space by inverting the coregistration and normalization stepd performed for visualizing the statistical maps in this anatomical view. The resulting ROI time course is shown in a corresponding Time Course Window in the same way as described for the Multi-Slice View. You may inspect the selected ROI in other visualizations by clicking on one of the view icons. Note that the amount of voxels included in the VOI definition depends on the ==Sphere Radius== value displayed instead of the Multi-Slice ROI Selection value in anatomical volume view. Since ROI selection is ultimately performed on the functional slice data. VOI - ROI selection and visualization operates in three stages:
- The voxels in a sphere defined by the position of the selected voxel are transformed back into voxels within the original slice data using a combined (inverted) spatial transformation linking the two spaces. The size of the VOI can be changed using the SphereRadius field in the right lower corner of the main window.
- The "back-projected" voxels in the original functional space corresponding to the spherical VOI in anatomical space are selected as the actual ROI voxels; those that are not passing the current statistical threshold and cluster threshold are excluded. The time courses of these voxels are used to calculate and display the ROI time course window.
- Using the spatial transformation linking the original space with the anatomical volume space, the positions of the determined ROI voxels are finally transformed "forward" to mark the corresponding voxels in the color of the respective ROI. This will adjust the original voxels in the sphere because of functional masking and spatial transformations handling (usually) different slice positions and spatial resolution.
Note. To prepare VOIs for neurofeedback and BCI applications using localizer runs or published MNI coordinates, see chapter Preparing Volumes-Of-Interest.
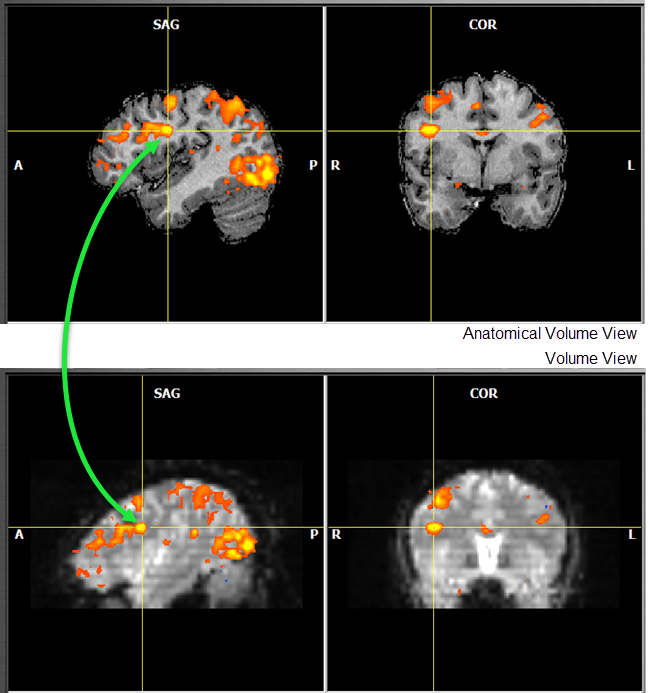
Since TBV 4.0 the various views are more tightly linked to each other helping in finding corresponding regions across visualizations. If, for example, a voxel is clicked in the ==Anatomical Volume View== and then one switches to the (EPI) ==Volume View, the cross will be automatically placed at the corresponding position and vice versa by performing the necessary spatial transformation (see figure below). Furthermore, clicking in a ROI time course window will place cross inside the corresponding VOI / ROI in both functional space volume and anatomical volume views.
Event-Related Averaging Plot
As the Volume View, the Anatomical Volume View also shows an Event-Related Averaging Plot in the lower left sub-window. For the current ROI, this plot depicts the average hemodynamic response evoked by a certain stimulus event or condition for the current ROI. If multiple ROIs are defined, click in one of the respective ROI Time Course Windows to make the corresponding ROI the current one. Note that since TBV 4.0, detrended ROI time courses are used to calculae event-relaed averaging (if not disabled).
Copyright © 2002 - 2024 Rainer Goebel. All rights reserved.