Turbo-BrainVoyager v4.4
Surface View
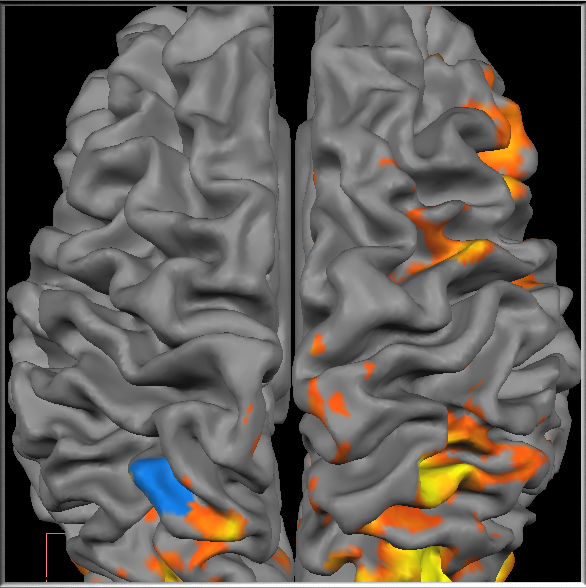
This view allows to visualize contrast maps on surface-rendered 3D models of the cortex (see snapshot below). The cortex meshes may be rotated and zoomed providing both useful overviews as well as detailed views on the brain. The meshes must reside in the same space (e.g., intra-session, AC-PC, Talairach) as the 3D data set shown in the Anatomical Volume View. The surface meshes must be prepared before the functional measurements using BrainVoyager QX and specified in the TBV Settings Dialog, for details, see section Prepare Advanced Anatomical Spaces.

![]()
To switch to Surface View, click one of the two Surface View Icons (see snapshot above) or press the S button. Both icons will be enabled if two meshes are specified in the TBV Settings Dialog, typically one mesh for the left and one for the right hemisphere. If only one mesh is specified, only the left icon is enabled. If two meshes are available, you may show or hide one of the two meshes by pressing the Left or Right Hemisphere Surface View Icon. You may navigate in Surface View by using the mouse or keyboard. Moving the mouse cursor up / down while holding down the left mouse button will translate the viewpoint. If in addition the SHIFT key is pressed down, the mesh can be rotated and if both the SHIFT and the CTRL key are down, the viewpoint moves towards or away the meshes (zooming).
To specify a ROI (also called Patch-Of-Interest or POI in this view), click with the left mouse button on a desired region of a mesh while holding down the CTRL key. The selected POI is visualized on the mesh by showing all involved mesh parts (triangles) in the same color as the color of the respective ROI (see blue color in the snapshot above). The time course of a specified POI is shown in a corresponding Time Course Window in the same way as described for the Multi-Slice View. You may inspect the selected ROI in other visualizations by clicking on one of the view icons. Note that the size of a POI depends on the value of the Multi-Slice ROI Selection since ROI selection is always performed on the raw slice data. Mesh-driven ROI selection and visualization operates in three stages:
- The position of the selected mesh vertex is transformed back into a position within the original slice data using a spatial transformation linking the two spaces.
- Voxels in the neighborhood within the respective slice as well as slices above and below (if Multi-Slice ROI Selection value > 1) are checked for inclusion within a prespecified neighborhood.
- Using the current spatial transformation, the positions of the determined ROI voxels are transformed "forward" to mark corresponding vertices on the mesh in the color of the respective ROI. In a similar way, ROIs are also marked in all other visualizations using the same definition in the original slice data.
Copyright © 2002 - 2024 Rainer Goebel. All rights reserved.