Turbo-BrainVoyager v4.4
The Graphical User Interface
The following figure shows the main parts of the graphical user interface (GUI) of Turbo-BrainVoyager's main window. Click on a region in the figure to obtain further information.
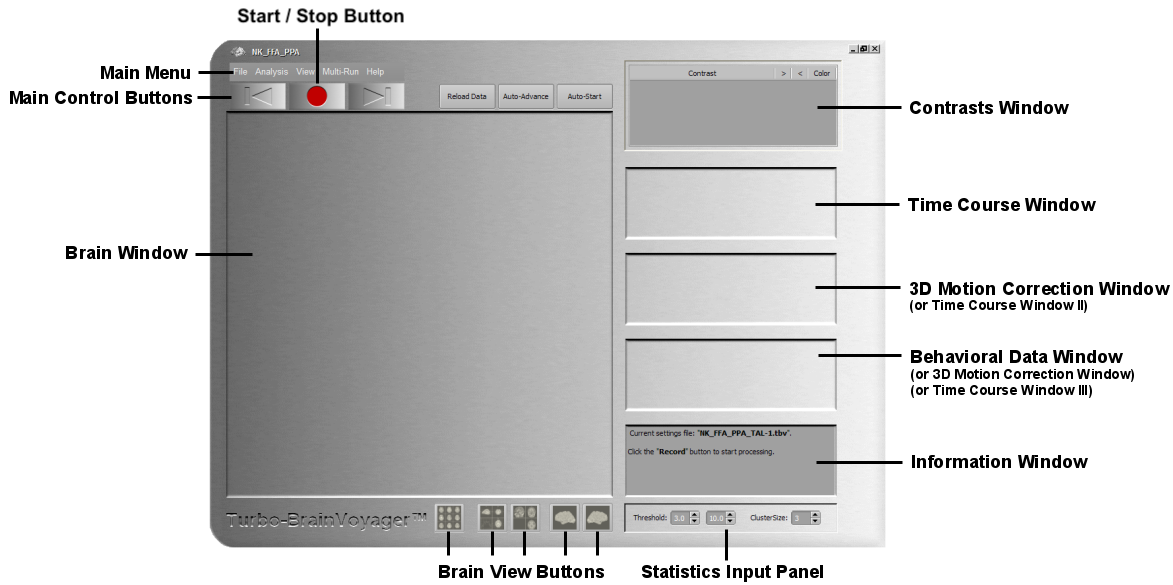
To start real-time data analysis, simply click the Start, which will change into the Stop button allowing to interrupt real-time processing if needed. Before starting real-time analysis, make sure that all relevant settings have been made.
Copyright © 2002 - 2024 Rainer Goebel. All rights reserved.