Turbo-BrainVoyager v4.4
Adding Confounds
The Confounds tab of the Data Simulator allows to specify the baseline signal level as well as linear and low frequency drifts. The baseline signal level is specified in the Constant number field (see screenshot below) and its default value is 1000. This means that the PSC effects defined in the Paradigm tab for conditions and regions will be added on top of the baseline level specified here for each generated voxel time course. If the default value is used (1000), the raw activation effect values generated will be multiplied by a factor of 10, i.e. a PSC value of 1.6 will be lead to a value of 1016. It is, of course, possible to change the baseline value in the Constant number field.
In case that the value in the SD number field is larger than 0.0 (default: 10.0), a random component is added on top of the specified baseline value for each voxel drawn from a Gaussian distribution with mean 0.0 and a standard deviation obtained from the SD number field. Note that this will lead to different voxel baseline levels.
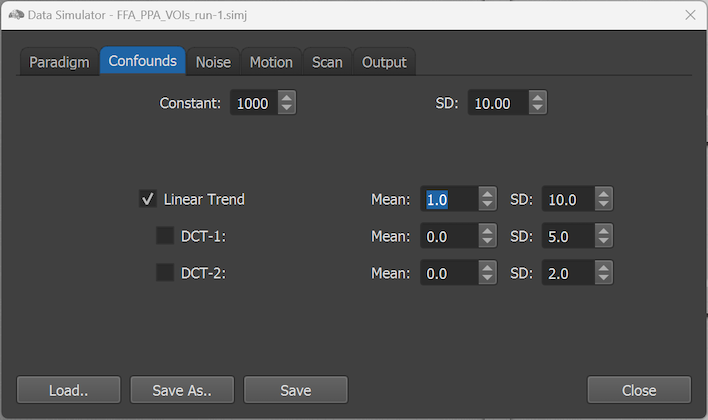
Without any drift (and potntial motion-related artifacts), the time course of a voxel would be stationary, i.e. its value would not change over time (besides added noise and simulated activation effects in some regions). To simulate linear and basic non-linear drifts, the Linear Trend, DCT-1 and DCT-2 option boxes can be turned on (checked). In the screenshot above, only a linear trend has been added by checking the Linear Trend option. This will create a linear trend for each voxel time course with the mean value specified in the Mean number field of the linear trend plus a Gaussian random component specified in the corresponding SD number field. While in the example above the linear trend value for the mean is set to 1.0, even a value of 0.0 would create linear trends (if enabled) since the SD value is set to 10.0 as default. In case one wants that each voxel has the same linear trend of value 1, one could set the SD value to 0.0. The random component ensures, however, that different linear trends (various positive and negative values) are simulated across voxels. Note that the mean and SD values are provided as raw values, i.e. a resulting trend value of 5.0 would add a trend from -5 to +5 to the stationary time course, while a value of -2.7 would add a trend from 2.7 to -2.7.
Besides a linear trend, a low frequency non-linear drift can be added by enabling the DCT-1 and DCT-2 drift option boxes. The corresponding mean and SD values are interpreted in the same way as described above, i.e. the DCT 'beta' values are determined by adding the specified value in the corresponding Mean field plus a Gaussian random component specified in the corresponding SD number field.
Copyright © 2002 - 2024 Rainer Goebel. All rights reserved.